
Although throughout the year we closely monitor air temperature trends, compare them with the past, and link them to the impacts of climate change, air temperature is not the only thermal parameter that influences our thermal comfort, food security, and ecosystem sustainability. Air temperature is measured at a height of 2 meters above the ground, with the thermometer placed inside a meteorological shelter that provides shade. This measurement tells us how warm the air is in the shade at that specific height.
However, much less attention is given to how warm the land surface itself becomes — both in natural landscapes and in urban areas — when exposed to solar radiation, wind, humidity, and other meteorological variables, and how climate change affects this temperature. Yet land surface temperature and its changes over time play a crucial role in shaping both the impacts of climate change and the effectiveness of adaptation measures.
Land surface temperature directly influences:
- Heat stress in cities — Hot surfaces intensify the urban heat island effect and negatively impact human health.
- Agricultural drought risk — Warmer soils accelerate moisture loss and may reduce crop yields.
- Forest health — High surface temperatures combined with drought increase tree mortality and the risk of bark beetle outbreaks.
- Water availability — Surface heating controls evaporation rates and determines how quickly soils dry out.
- Climate adaptation planning — Identifying areas that are warming more rapidly helps guide green infrastructure development and targeted cooling strategies.
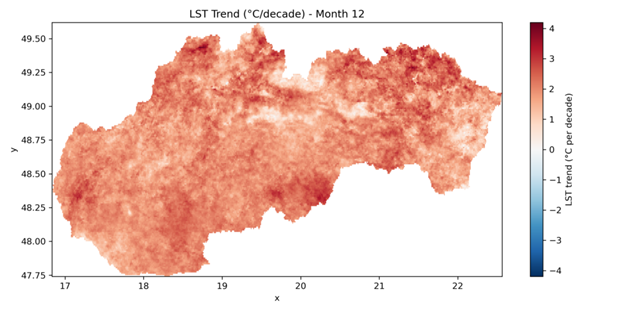
Winter warming and its consequences
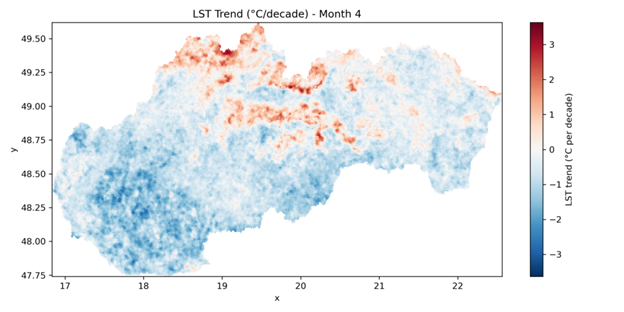
Our analysis of monthly land surface temperature (LST) trends across Slovakia reveals a pronounced seasonal shift in warming patterns. Winter months show strong and widespread surface warming, while April and May exhibit a surprising cooling trend over large areas, followed by renewed warming during summer and early autumn.
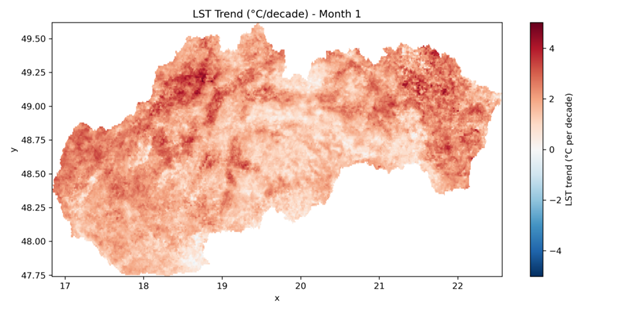
The winter signal is particularly striking: land surfaces are warming rapidly during the coldest part of the year. This means fewer frost days, thinner and shorter-lasting snow cover, and more frequent winter thaw events. Snow, which normally acts as a natural water reservoir, melts earlier and reduces spring water availability.
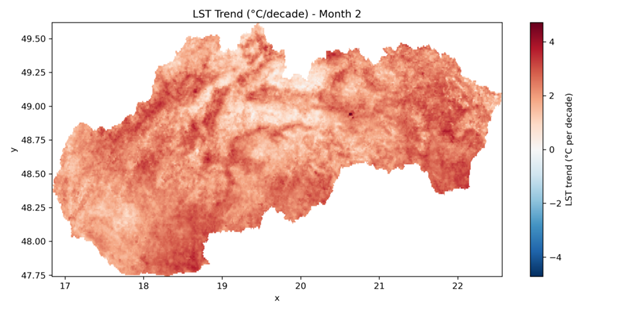
Warmer winter soils also fail to freeze as deeply as in the past, affecting soil structure, nutrient cycles, and agricultural conditions for the following growing season. In forests, milder winters allow pests such as bark beetles to survive more easily, increasing the risk of outbreaks. At the same time, reduced snow cover exposes vegetation to frost damage during sudden cold spells, creating additional stress.
The spring paradox: warming followed by cooling
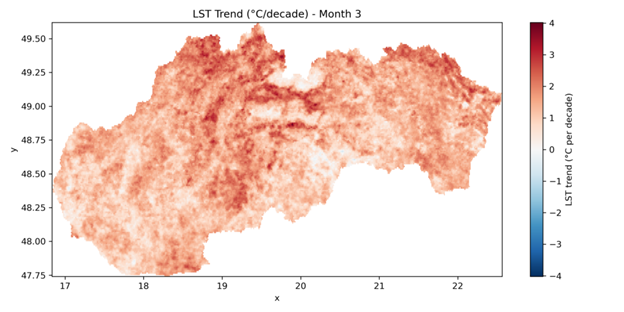
This winter warming does not stop with February. March already shows strong and widespread surface warming, indicating that the transition from winter to spring is occurring earlier and more rapidly than in the past. Snow cover disappears sooner, soils thaw earlier, and vegetation begins to activate ahead of its historical timing. As a result, the natural “resting period” of the landscape shortens.
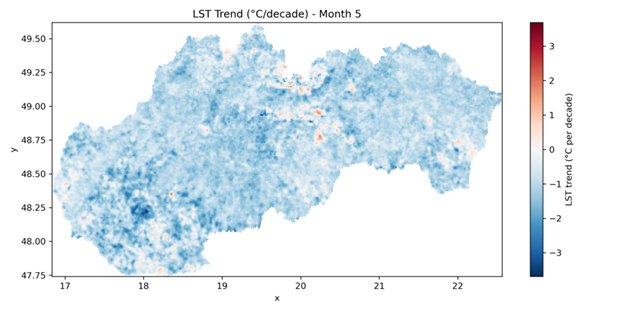
However, in April and May the pattern shifts: large parts of Slovakia, especially lowland and agricultural regions, exhibit a cooling trend of land surface temperature. This apparent contradiction likely reflects intensified vegetation growth and enhanced evapotranspiration, where more solar energy is used to evaporate water rather than heat the ground. In other words, the landscape begins cooling itself through biological activity. Yet this early and stronger spring activation may also lead to faster soil moisture depletion, increasing vulnerability to summer drought.
Together, the winter warming, March acceleration, and spring cooling signal reveal a profound seasonal redistribution of energy and water processes, showing that climate change is not only raising temperatures, but reshaping the timing and balance of Slovakia’s entire climate system.
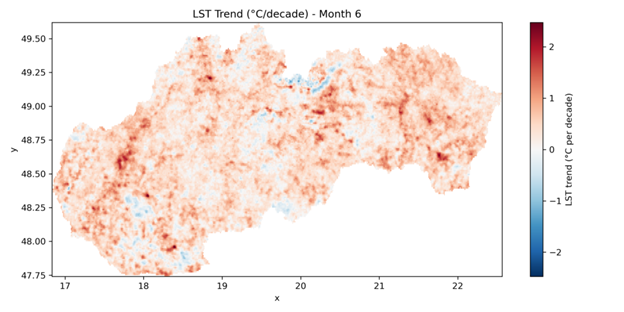
Summer intensification and autumn extension
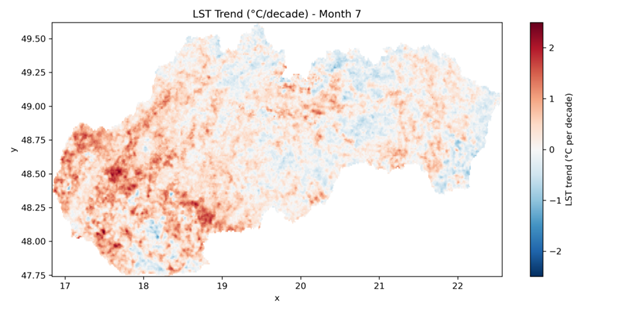
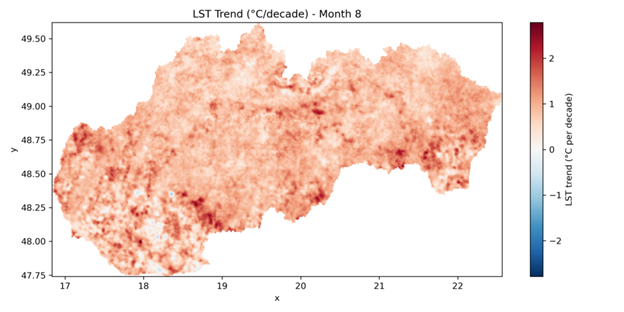
June already shows renewed warming in many regions, and by July and August, land surface temperatures increase clearly and consistently across most of Slovakia. The strongest warming signals appear in lowland and urbanized areas, where soils dry more rapidly and vegetation cooling becomes limited by water availability.
Once soil moisture declines, less energy is used for evaporation and more is converted into sensible heat, causing the land surface to warm more intensely. This amplifies heatwaves, increases agricultural drought stress, and heightens wildfire risk in forests. In cities, warmer surfaces intensify the urban heat island effect, prolonging nighttime heat stress and affecting human health.
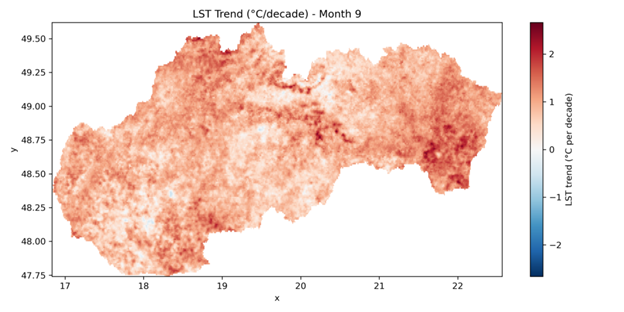

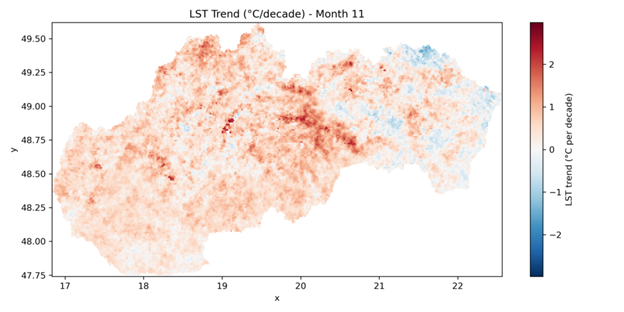
In autumn, land surface temperatures generally show renewed warming, especially in September, indicating that warm conditions are extending later into the year. October appears more transitional, with mixed regional patterns, while November again shows warming in many areas. This suggests that the cooling season is starting later than in the past, potentially prolonging the growing season but also delaying soil moisture recharge and leaving landscapes drier before winter.
A climate baseline that keeps shifting upward
Our analysis shows that climate change in Slovakia does not affect all seasons in the same way. The warming is uneven across the year, shifting the natural rhythm of winter, spring, summer, and autumn. Overall, the results demonstrate that climate change is reshaping not only how warm it becomes, but also when and how energy and water move through the landscape. Snow melts earlier, vegetation starts sooner, soils dry faster, and summer heat intensifies. The seasons are gradually losing their traditional timing and balance.
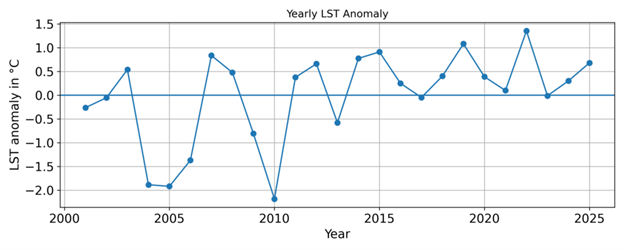
The figure clearly illustrates this shift: in recent years, warmer-than-usual land surface conditions have become more frequent. The land is spending more time in a warmer state than it did in the past — a signal that the baseline of our climate is steadily moving upward.
Where does the land surface temperature data come from?
The land surface temperature (LST) data used in this analysis come from the MODIS instrument (Moderate Resolution Imaging Spectroradiometer) aboard NASA’s Terra and Aqua satellites. These satellites have been orbiting the Earth since 1999 and 2002, respectively, and observe the planet’s surface every day.
Unlike ground thermometers, which measure air temperature at a single location, MODIS measures temperature from space using thermal infrared radiation. Every object warmer than absolute zero emits heat energy, and the warmer it is, the more infrared radiation it releases. The satellite detects this radiation and converts it into temperature using well-established physical principles.
Under clear-sky conditions, the accuracy is typically around ±1°C over vegetated areas. The measurements are regularly calibrated and compared with ground stations to ensure reliability. Because satellite data cover the entire country in a consistent grid, they allow scientists to detect regional patterns and long-term changes that cannot be seen from individual measurement stations alone.
Data source: MODIS Land Surface Temperature & Emissivity (MOD11A2 v061) — NASA LP DAAC, USGS EROS Center.
Analysis: Regional Climatological Institute, 2026. Based on MODIS/Terra LST data (2000–2025). Title image: Science/NASA.